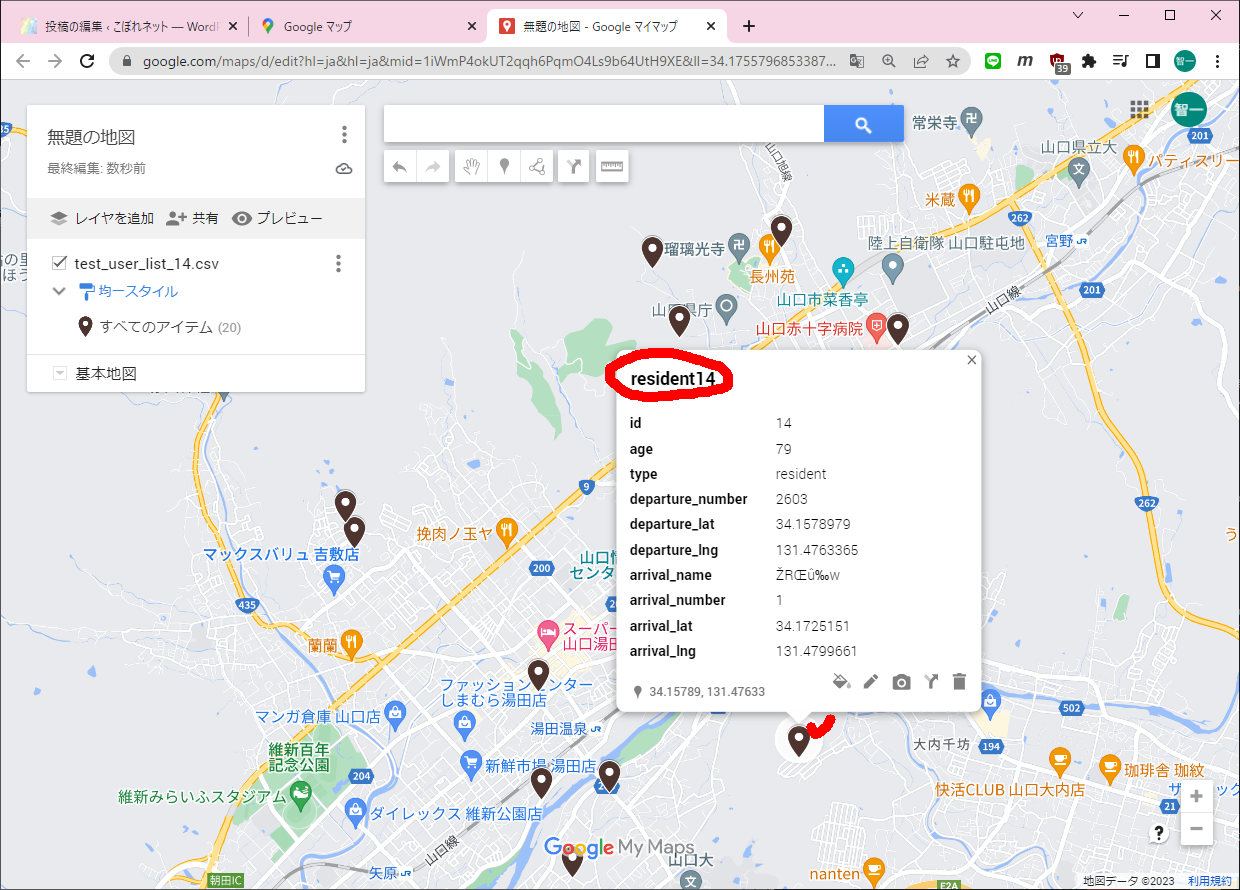
まずGISのDBにアクセスしておきます(必要なのかどうかは不明です)。
C:\Users\ebata>psql -U postgres -h 192.168.0.23 -p 15432Password for user postgres:psql (13.4, server 12.5 (Debian 12.5-1.pgdg100+1))Type "help" for help.postgres=# \c kitaya_dbpsql (13.4, server 12.5 (Debian 12.5-1.pgdg100+1))You are now connected to database "kitaya_db" as user "postgres".
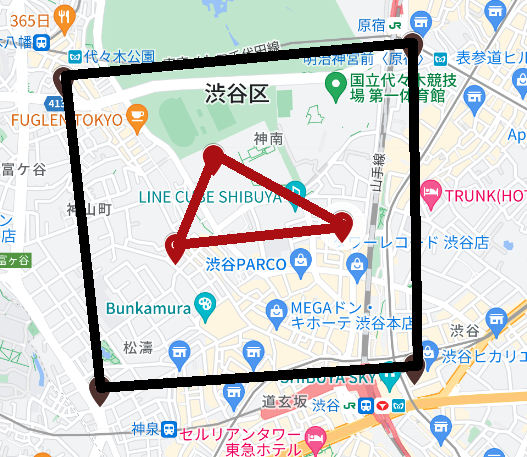
kitaya_db=# SELECT ST_Covers(st_geomfromtext('POLYGON((35.66776966314929 139.6895046225338,35.657947599160494 139.69091202947678,35.65865130959591 139.70318173103095,35.66885441403114 139.70307346895845,35.66776966314929 139.6895046225338))'), st_geomfromtext('POLYGON((35.66527761205352 139.6953146870933,35.66246296668681 139.69387119279278,35.66316663733071 139.70036691714503,35.66527761205352 139.6953146870933))'));
st_covers
-----------
t
(1 row)
(2)領域の中に領域が含まれていない場合です。
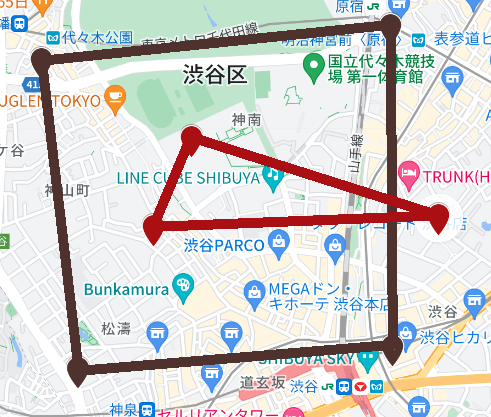
kitaya_db=# SELECT ST_Covers(st_geomfromtext('POLYGON((35.66776966314929 139.6895046225338,35.657947599160494 139.69091202947678,35.65865130959591 139.70318173103095,35.66885441403114 139.70307346895845,35.66776966314929 139.6895046225338))'), st_geomfromtext('POLYGON((35.66527761205352 139.6953146870933,35.66246296668681 139.69387119279278, 35.662818 139.7050018, 35.66527761205352 139.6953146870933))'));
st_covers
-----------
f
(1 row)
(3)領域の中に点が入っている場合です。
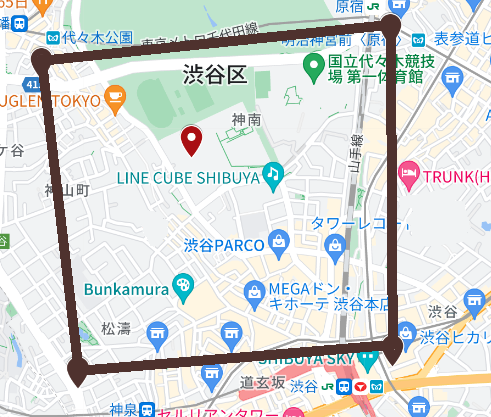
kitaya_db=# SELECT ST_Covers(st_geomfromtext('POLYGON((35.66776966314929 139.6895046225338,35.657947599160494 139.69091202947678,35.65865130959591 139.70318173103095,35.66885441403114 139.70307346895845,35.66776966314929 139.6895046225338))'), st_geomfromtext('POINT(35.66527761205352 139.6953146870933)'));
st_covers
-----------
t
(1 row)
(4)領域の中に点が入っていない場合です。
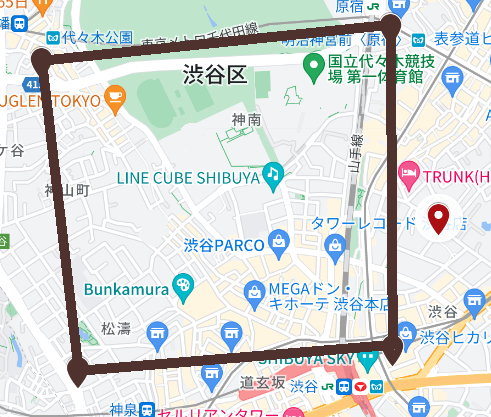
kitaya_db=# SELECT ST_Covers(st_geomfromtext('POLYGON((35.66776966314929 139.6895046225338,35.657947599160494 139.69091202947678,35.65865130959591 139.70318173103095,35.66885441403114 139.70307346895845,35.66776966314929 139.6895046225338))'), st_geomfromtext('POINT(35.662818 139.7050018)'));
st_covers
-----------
f
(1 row)
以上